

There is no such thing as a free lunch. When global oil prices rise sharply, as they are doing now, someone must bear the cost. Some countries choose to absorb it through government support, as in Japan, while others pass the burden on to consumers, as in Thailand. Neither approach is inherently right or wrong; each carries different economic consequences. Policymakers must decide which set of outcomes is more acceptable and act accordingly.
In my previous article, I recommended the government shoulder the initial burden and allow consumers and producers to gradually absorb the costs later, given the fragility of the economy, marked by weak GDP growth and high household debt.
However, if the government takes the alternative route, it must be prepared to face the consequences of higher domestic oil prices.
Most economists would agree these consequences include slower GDP growth and rising inflation. In reality, however, an oil price shock triggers a broader set of six interrelated effects. The most critical is the current account balance, which sits at the top of the economic "food chain" and sets off a chain reaction affecting five other variables. Allow me to explain.
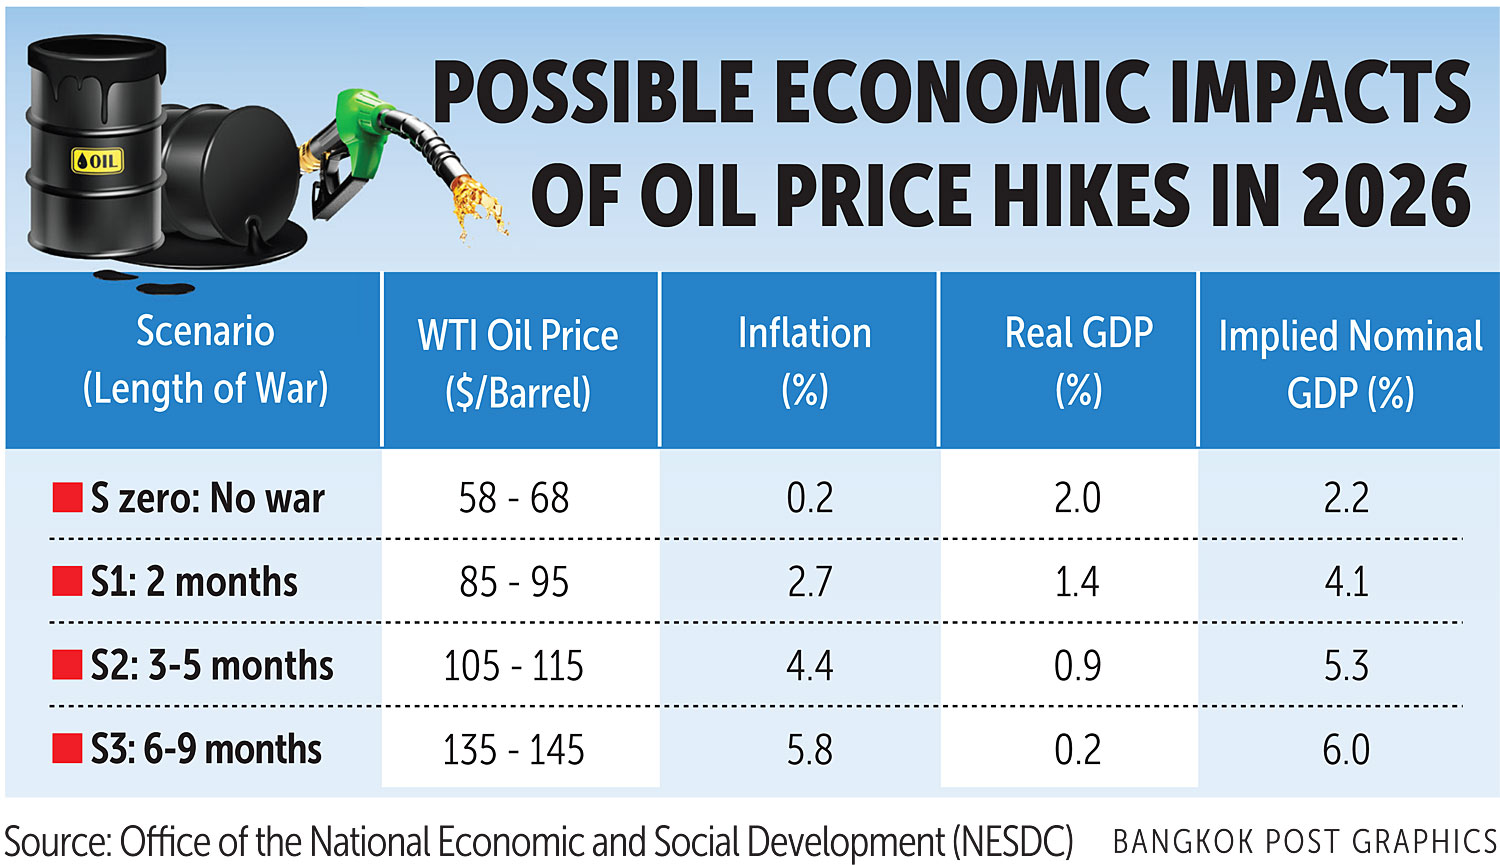
The National Economic and Social Development Council (NESDC) appears to take a more limited view of these consequences. It has produced simulations of the economic impact of oil price increases under four scenarios (see table).
For the benefit of readers who may not be able to view the table, I will describe the results. The simulations, labelled S0 to S3, project the impact of oil price shocks on the Thai economy in 2026.
Under S0 -- the "no-war" scenario -- real GDP growth is expected to be 2.0%, with inflation at 0.2%. In S1, the mild scenario, global oil prices rise to US$85–95 (2,720-3,039 baht) per barrel, reducing GDP growth to 1.4% while pushing inflation up to 2.7%. In S2, the moderate scenario, oil prices climb further to US$105–115, with growth falling to 0.9% and inflation rising to 4.4%. In S3, the severe case, prices reach US$135–145, leaving GDP growth at just 0.2% while inflation surges to 5.8%.
At first glance, these projections appear reasonable: higher oil prices lead to lower growth and higher inflation. However, closer inspection raises questions -- particularly when considering the final column of the table, which shows implied nominal GDP growth. Nominal GDP growth is simply the sum of real growth and inflation.
Again, for those unable to view the table, the implied nominal GDP growth rates for S0 through S3 are 2.2%, 4.1%, 5.3%, and 6.0%, respectively.
This raises a fundamental question: how can nominal GDP growth in the severe scenario (S3) reach 6.0%, significantly higher than the 4.1% recorded in the mild scenario (S1)? How could incomes appear stronger when oil prices are much higher? Should the opposite not be the case? Does the NESDC assume that wages will rise sufficiently with inflation to boost consumption and, in turn, nominal GDP?
Such inconsistencies cast doubt on the credibility of the simulations produced by the state think tank. As an economist, I can offer a plausible explanation. The projections appear to be derived from two separate econometric models -- one for GDP growth and another for inflation -- each producing its own results without sufficient cross-checking.
By contrast, I adopt what I call a "chain reaction" approach, which integrates all relevant variables into a single framework. This approach begins with the current account -- the top of the economic food chain -- and traces six interconnected links: (1) the current account balance, (2) the exchange rate, (3) inflation, (4) liquidity conditions, (5) interest rates, and (6) GDP growth. Notably, GDP sits at the bottom of this chain, not the top. Estimating it in isolation risks the kind of inconsistencies evident in the NESDC's exercise.
This framework is not hypothetical. It is grounded in observation of the 2022 oil shock following the Russia–Ukraine war. At that time, Brent crude prices rose sharply, producing a sequence of effects similar to what we are seeing today. With oil prices again on the rise -- from around US$65 per barrel in 2025 to a projected average of US$94 in 2026 -- there is little reason to expect a different pattern.
Let us begin with the current account. Higher oil prices translate directly into higher import costs. Oil payments are estimated to rise from US$41 billion in 2025 to US$63.5 billion in 2026. Freight costs will also increase, as higher fuel prices push up transport expenses. Thailand spent US$23.5 billion on freight in 2025; I estimate this could rise by a further US$4.7 billion.
Taken together, these two factors -- higher oil imports and increased freight costs -- could shift Thailand's current account from a surplus of US$15.9 billion last year to a deficit of US$11.3 billion this year.
This is where the chain reaction begins. A current account deficit implies that more dollars are flowing out of Thailand than coming in. Basic supply and demand dynamics dictate that the baht will weaken. Compounding the problem, a weakening currency often prompts foreign investors to withdraw funds, fearing further depreciation.
In March 2026, the combined effect of the current account deficit and capital outflows amounted to US$10.2 billion, compared with a net inflow of US$1.2 billion just a month earlier.
The only reason the baht has not depreciated more sharply is the Bank of Thailand's intervention in the foreign exchange market. However, such intervention cannot continue indefinitely. Eventually, market forces will prevail, and the baht will weaken -- much as it did following the 2022 oil shock.
How far could it fall? While I do not claim to be a currency forecaster, past experience offers some guidance. In 2022, the baht depreciated from 32.2 to the dollar in mid-February to 38.3 by October. A similar trajectory in 2026 would not be surprising.
So far, I have discussed only the first two links in the chain: the current account and the exchange rate.
Four more remain -- inflation, liquidity, interest rates, and GDP growth. However, space constraints prevent a full explanation here.
I will therefore address the remaining links in the next article. I apologise to readers for the delay.
